How to Run a Retention Analysis
By performing retention analysis in Loops, you can evaluate the retention behavior of different cohorts and segments of users over time. To learn more about the goals of this analysis, understand some key concepts, and see some common use cases, see Retention Analysis Overview.
In this article, we’ll explain how to set the parameters for the analysis, and then run the analysis.
Step 1: Set parameters for your retention analysis
Setting the parameters for a retention analysis is quick and easy, and will directly impact the results you see. Here’s how to get started:
- Click the "Analyses" tab on the left side of the screen.
- Click the New Analysis button at the top-right corner of the page, and select “Retention Analysis”.
- Configure the parameters. To help guide you through this process, we’ve provided an explanation for each one below.

Entity Type
An entity is the basic unit of an analysis – it is the user or group for whom engagement is measured. In retention analysis, a cohort consists of multiple entities.
If you choose “User”, cohorts will consist of individual users (e.g. users who joined your product during a particular month). If you choose “Account", cohorts will consist of accounts (e.g. teams or departments who joined your product during a particular month).

Retention Definition
The two parameters in this section define what constitutes a retention moment, and specify the point from which user engagement should be measured.

“What is the Starting Point?”
In retention analysis, retention is measured from the Starting Point onwards. A Starting Point may be an event, feature, funnel, milestone or property that occurs for any user or account
It also serves as a reference date for each cohort. In other words, cohorts are defined based on when their Starting Point occurs (e.g. March 2023, June 5-11 2023, etc.)
In many cases, this parameter will be a one-time activation event, such as a user joining your product or service. However, it can also be an event that occurs more than once – in such cases, Loops will use the first time the event appears in a user’s history.
Default value: Join Date
Other examples: First Usage, First Day of Payment
“What event(s) indicate retention?”
Select one event, multiple events, or a pre-defined group of events that describe a retention moment. If a user performs one of those events, retention will have occurred.
Default value: Active
Other examples: Any engagement event, Payment event, Feature usage
Cohorts and Buckets
These parameters define the cohorts and buckets you wish to analyze. To understand how they are established on the basis of your analysis time frame, see How Cohorts and Buckets are Formulated.
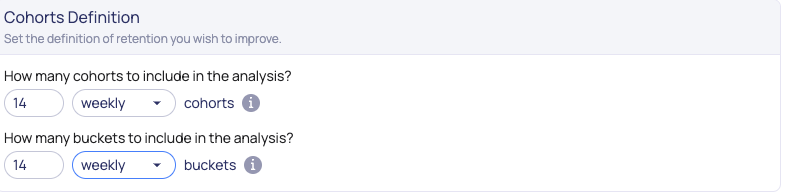
“How many cohorts should be included?”
Select how many cohorts you wish to analyze, and choose whether they should be aggregated on a daily, weekly or monthly basis.
Let’s say you select “8 weekly cohorts”. This would produce 8 cohorts of users that are grouped by their week of join date (assuming “Join Date” was selected as your Starting Point.)
“How many buckets should be included?”
Select how many buckets to include in the analysis, and choose whether they should be defined on a daily, weekly, monthly or custom basis.
Let’s say you select “12 weekly buckets”. This would result in 12 buckets that measure retention for each week after the Starting Point: Week 0, Week 1, Week 2, all the way to Week 11.
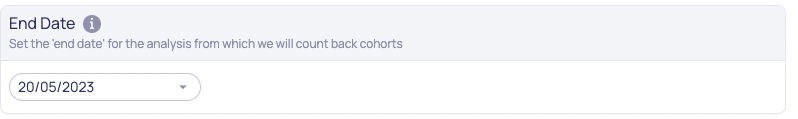
End Date
Select an end date for your analysis, and Loops will count backwards from this date in order to establish your cohorts and buckets.
To better understand how selecting an End Date defines your cohorts and buckets, see “How Cohorts and Buckets are Formulated”
Segmentation filter (optional)
Use this filter to focus your analysis on a particular segment of users (e.g. based on their country or device OS). If you use it, your analysis will only include data for users in that segment.
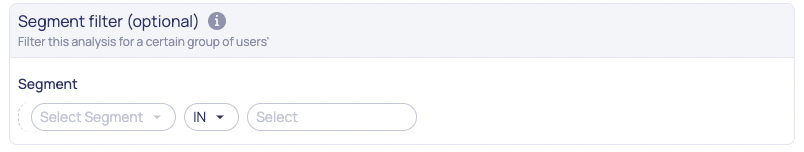
For additional information, see how to use the segmentation filter.
Group By (optional)
Use this parameter to group analysis results on the basis of a particular segment, KPI or funnel.
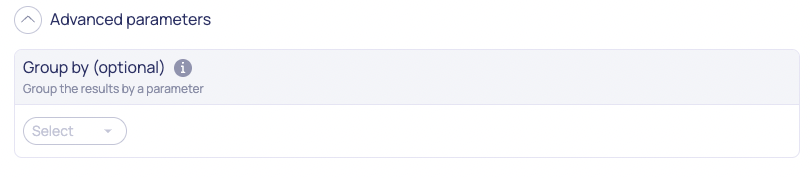
This grouping will be reflected by a number of segmentation tabs that appear for each visualization in your analysis results. Below is an example of how it might look if you grouped your data by “Job Title”. You’ll be able to click each tab to filter the results that are displayed

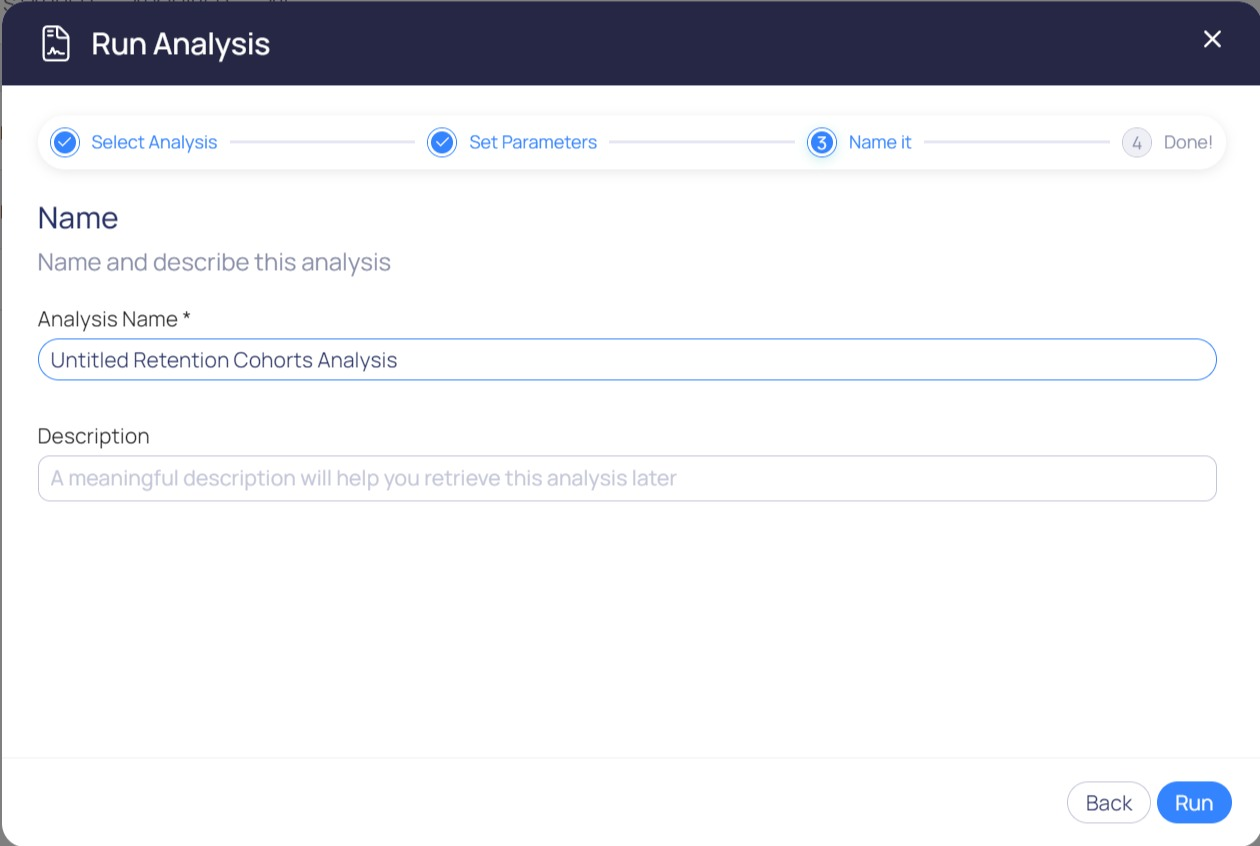
Step 2: Name and run the analysis
Once you’ve configured of all your parameters, you’re ready to run the analysis:
-
Click the Next button, which will open a pop-up.
- Enter a unique name and description for your analysis.
- Click the Run button and the analysis will be launched.
- An estimated running time will appear, and you’ll receive an email notification when the analysis is complete.
Once an analysis has been initiated, it will appear in the “Analyses” section of Loops, under “My Analyses”, as illustrated below:

Here, you’ll be able to see its status (e.g. “Running”, “Completed”) and whether there was an issue that prevented it from running successfully. You’ll also be able to share it, rename it, re-run it, and perform a number of other actions.