
Uplift Modeling
Introduction
The Uplift Modeling Analysis takes an experiment you've already run and answers a question a standard A/B test can't: should everyone get the same variant, or should different users get different ones?
An A/B test tells you which variant wins on average. Uplift Modeling estimates the effect of each variant per user, then turns that into an assignment policy you can ship - e.g. "show the carousel to new users on mobile, keep the old flow for everyone else." Because the assignment comes from a randomized experiment, the effects are causal, not correlational.
Use it when the average result may be hiding something: a winning test that quietly hurt some users, a losing test that still works for a segment, or a flat test where a positive and a negative effect cancel out.
Inputs
- Linked A/B Test: The experiment whose variants we personalize over. The dropdown lists the A/B experiments defined in your Experiments module - if the experiment you want isn't there, it needs to be set up there first (only A/B-type experiments are eligible, since the analysis relies on random assignment).
- Goal Metric: The KPI the policy optimizes. The analysis respects whether higher or lower is better.
- Constraint Metrics (optional): Metrics you don't want to damage while chasing the goal.
-
Signals - Pre-treatment signals used to find which users respond differently to each variant, by default all segments and features are automaticly used
The user attributes available to the policy are picked up automatically from your data. Only pre-treatment attributes are used - anything measured before the user entered the experiment - so a rule can never be built on an outcome of the treatment itself.
Outputs
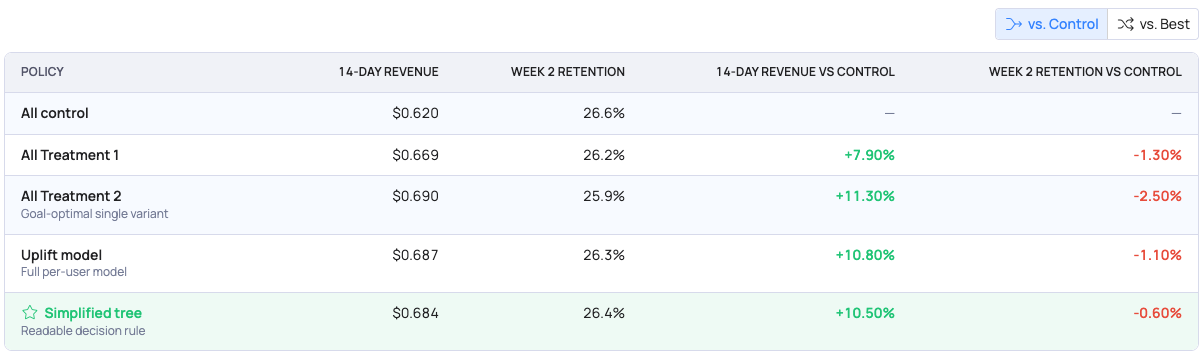
Policy Comparison: The candidate policies side by side, each scored on your goal and secondary KPIs:
- All control and All <variant> - the blanket options, i.e. what a normal rollout gives you.
- Uplift model - the full per-user model. Read it as a ceiling: how much exploitable heterogeneity exists at all, and the bar the readable rules are measured against. It is never the recommendation —-a per-user model isn't something you ship.
- Simplified tree - that model distilled into a handful of readable rules. This is the only personalized policy that can be recommended.
Each policy is scored against two baselines, vs Control and vs Best Variant (see below). Deltas shown in grey are not statistically significant - treat them as noise, not as small wins.
vs Control and vs Best Variant
Every policy is measured against two baselines, and they answer different questions:
- vs Control - is this better than the current experience? This is the familiar A/B question: what you gain by moving off control at all. For the blanket rows it is essentially your A/B test result.
- vs Best Variant - is this better than simply shipping the winner? The best single variant is the realistic alternative to personalizing: you already know you can ship it, at almost no engineering cost. This column isolates the incremental value of personalization on top of that, and it is the number that should decide whether building the rules is worth it.
A policy can look impressive against control and add nothing against the best variant. That happens when the model has simply learned to give almost everyone the winning variant - real, but not a reason to build targeting logic. The reverse also happens: in an experiment where no variant beat control, a policy can be flat against control while genuinely beating the best variant, because it avoids the users the treatment hurt.
Some cells are structurally zero, not missing data: All control has nothing to compare to control, and All <best variant> has nothing to compare to the best variant. A personalized policy that fell back to a blanket arm shows zeros for the same reason.
One presentation note: blanket rows report the observed variant averages (matching your A/B test), while personalized rows report paired doubly-robust estimates - the same basis the significance test uses. The two can differ slightly for the same underlying assignment.
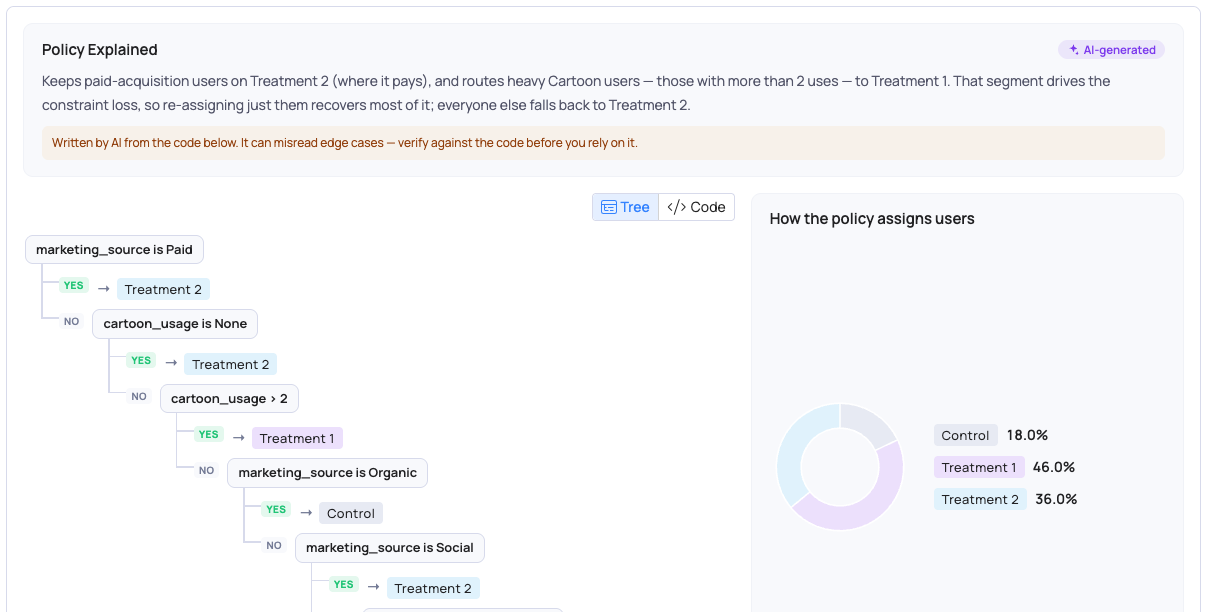
Deployable Policy: The rules themselves - as a decision tree, as plain-language rules, and as code - with a written explanation of what the policy does.
When Personalization Is Recommended
Personalization is only recommended when it's earned. A personalized policy must significantly beat both baselines - the control and the best single variant. Requiring both matters: beating only control means the model found the winning variant, which you could have shipped anyway, and beating only the best variant on a noisy goal is something a flexible model will do by chance often enough to be untrustworthy.
If a policy fails that test, it falls back to the best single arm and the honest recommendation becomes "there is no exploitable heterogeneity here, ship variant B to everyone" - a common and correct outcome. The learned rules are still displayed in that case, labelled Learned policy rather than Deployable policy, so you can see what the model found without being invited to ship it.
Methodology
Step 1: Model training & policy search - Pre-treatment inputs are engineered into model features (outlier-clipped measures, missingness flags, log-scaled skewed measures, and category frequencies). Several causal learners (T-/S-learner over gradient-boosted trees and a linear baseline) then estimate each entity's outcome under every variant; the best is chosen by out-of-fold score. A Lagrangian sweep trades the goal against the constraints to choose the best assignment policy.
Step 2: Model evaluation - Policy value is scored out-of-fold with a doubly-robust (AIPW) estimator using the experiment's known assignment probabilities, with significance tested at the experiment's configured confidence level — so the reported lift is honest, not in-sample optimism. A policy is only recommended if it beats the best single arm significantly.
Step 3: Distillation into shippable rules - The per-user policy is distilled into a decision tree at most 4 levels deep over interpretable attributes, so the result is a rule you can implement rather than a model you have to deploy. Every leaf must hold at least 200 entities or 2% of the sample, whichever is larger, so the tree won't split on a sliver of users that happened to look good by chance.
Requirements
The experiment needs at least 500 users with an outcome and at least two variants of meaningful size. Rare outcomes - sub-1% conversion, mostly-zero revenue - leave little signal to personalize on, and typically fall back to a blanket recommendation.